Works
Data Representation using Microsoft Excel
Portfolio
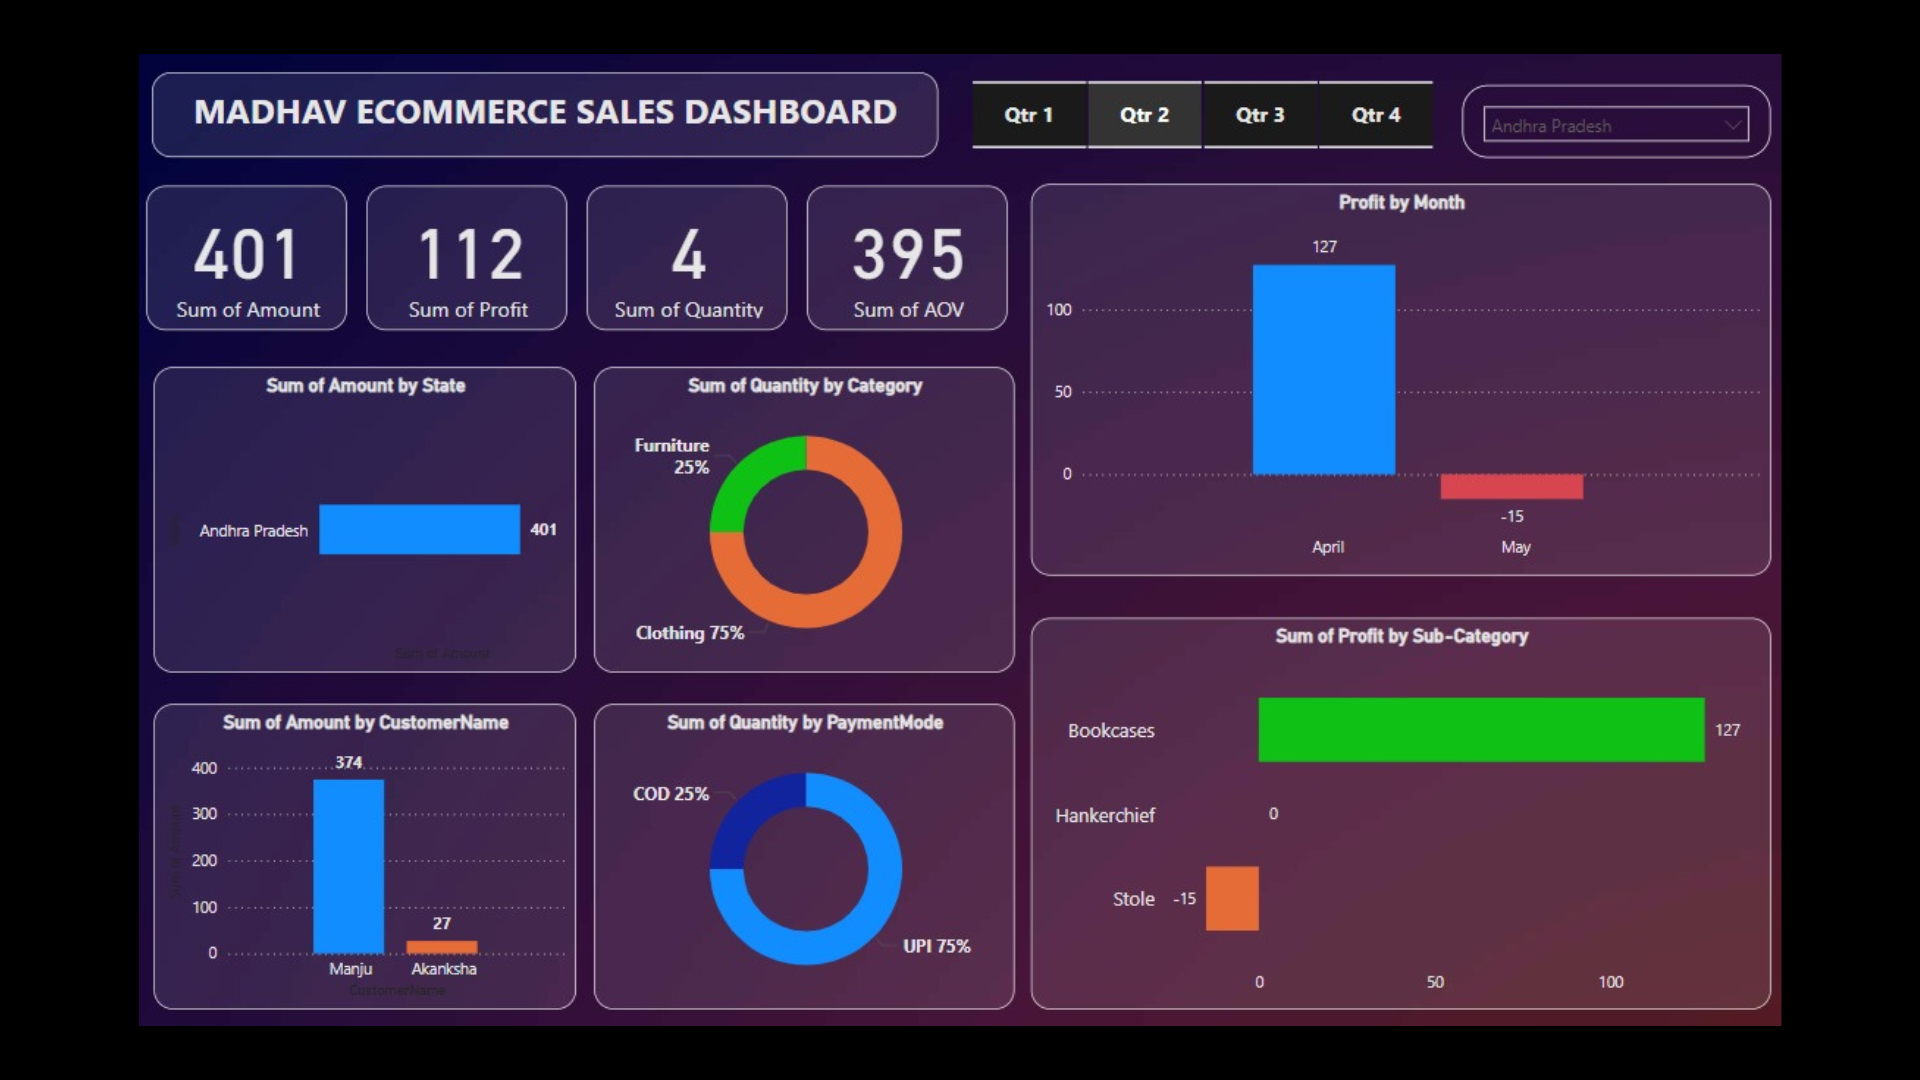
An Online Store Sales Dashboard Based on PowerBi
The project centers on using Microsoft Excel to perform detailed data analysis and transform raw data into insightful visual representations. Focusing on an online store, the analysis covers key performance segments such as orders, sales, profit, and shipping days. By meticulously categorizing sales data according to payment mode, region, segment, subcategory, month, and shipping mode, the project aims to provide a comprehensive understanding of the store's operations. This detailed segmentation is crucial as it helps identify specific patterns and trends, offering a granular view of the business's performance across various dimensions. For instance, by analyzing sales data by payment mode, the project can reveal which payment methods are most popular, aiding in optimizing payment options for customers
Utilizing Excel's powerful charting capabilities, the project transforms this segmented data into a variety of visual representations, including charts, line graphs, and bar graphs. These visual tools are essential for making complex data more accessible and easier to interpret. Line graphs, for example, can illustrate sales trends over time, helping to identify peak sales periods and seasonal fluctuations. Bar graphs can compare sales performance across different regions or product categories, providing clear insights into which areas are performing well and which may need more attention. Additionally, by incorporating geographical data using Microsoft Bing, the project can visually map sales data to specific locations, highlighting regional performance differences. This geographical analysis is particularly valuable for identifying high-demand areas and tailoring marketing and sales strategies to those regions.
A significant aspect of the project is its capability to forecast future sales and predict demand in specific regions. By leveraging historical sales data and applying forecasting techniques, the Excel dashboard can provide predictive insights that are invaluable for strategic planning and resource allocation. For example, if the data indicates an increasing demand for certain products in a particular region, the company can proactively adjust inventory levels to meet this anticipated demand, thereby avoiding stockouts and maximizing sales opportunities. This predictive ability not only enhances supply chain efficiency but also improves customer satisfaction by ensuring that popular products are readily available. Overall, the project’s thorough data analysis and visual representation using Excel facilitate informed decision-making, enabling the online store to operate more strategically and efficiently.